The Wisdom of Warren
It is now October: “spooky season,” as many refer to it, a time for watching scary movies, dressing in costumes, and carving pumpkins. This October, there is no shortage of scary-goings-on in the world: the COVID-19 pandemic, economic recession, unemployment, stock market volatility and political uncertainty, to name a few. While the year began with the domestic stock market reaching new highs, by March, the onset of the COVID-19 virus spooked investors, and the S&P 500 Index lost 34% of its value in one month. Between March 24 and August 31, the S&P 500 index rebounded with an astounding 57.7% return. Since the end of August, the S&P 500 Index has again retreated amid continued investor uncertainty. Having observed the domestic stock market becoming even more expensive, we took action in August to realize equity gains by rebalancing client portfolios. The rebalance (which excluded the gold segment) accomplished a variety of goals including:
Returning client portfolios to equity targets,
Reestablishing our 50/50 balance between growth and value strategies within the equity segment,
Increasing the weighted average duration of the fixed income segment, and
Raising the average credit quality of the high yield bond segment.
Gold has been the best performing asset class in client portfolios for the past 12 months and in most client portfolios, exceeds its 5% target. We chose not to rebalance gold back to target at this time and to let it continue to drift. Gold tends to do well when the U.S. Dollar is declining, the government budget deficit is rising, and when economic and market uncertainty is prevalent. We continue to monitor the markets and the economy, and to make changes to our strategy as opportunities arise.
We would like to share the following article written by Shu Chin Li, Towneley’s Director of Research and Portfolio Strategies, in which Ms. Li discusses some of the factors we consider when valuating the stock market.
The Wisdom of Warren
By Shu Chin Li, M.S., M.B.A., CFA®
During the third quarter, the media released news of Warren Buffet’s two latest investment acquisitions. The billionaire’s investments do not always catch our attention, but this time it is different. Mr. Buffet seems concerned about the dollar’s weakness. He may also be worried about U.S. stock market valuations, which are at historic highs compared to those of some foreign stock markets.
This year Warren Buffet turns 90, and his net worth comes to about $90 billion. He is probably one of the world’s most successful investors who made most of his fortune from stock investing. He bought his first stock at age 11 and in his high school yearbook, he wrote, “He wishes to be a stockbroker.”
What did the recent news say about his new investments? During the second quarter, Mr. Buffet bought Barrick Gold shares for just over half a billion dollars or over 1% of the gold producer’s outstanding shares. The price of gold in dollars has surged this year, starting from around $1,500 per ounce in early January, and is now over $1,900 per ounce. In the past two months, the gold rally accelerated, hitting a new high of $2,063 per ounce on August 6, while the dollar was plummeting. The Dollar Index dropped sharply, touching the 92 level, or a 2-year low. The billionaire investor has been known for scorning gold because it, unlike stocks, cannot yield dividends. His investment style adheres to the law of compounding, which turns modest dividends into great profits over the long term. Perhaps, the billionaire investor is concerned more about the dollar weakness than getting stock dividends.
The other investment is, somewhat, tied to the issue of the weak dollar. Mr. Buffet’s holding company revealed last August that his firm invested nearly $7 billion in five Japanese stocks over the course of 12 months, and also disclosed its 2nd quarter’s sales, including US bank shares, such as JP Morgan, Goldman Sachs, and Wells Fargo. This divestment occurred at the time US stock markets were charging upward; two major American indexes, the S&P 500 Index and the Nasdaq’s Composite positioned to reach new highs.
Nasdaq climbed over the 12,000 level in early September, delivering a stunning gain of over 30% through through September 30, 2020. The S&P 500 Index’s performance was a bit less glamorous, but still the Index climbed over the 3,500 level for the first time in late August. Moreover, the S&P 500 Index completely erased the deep loss that occurred during the pandemic crisis.
Is Mr. Buffet simply fearful when others are greedy? American bank stocks, in fact, have a poor outlook not only because rates are low, but also due to potential loan losses that could offset bank profits during this pandemic-caused recession.
Why Japanese stocks? Another rationale behind his acquisition of Japanese stocks is that they are trading at depressed values. We must come back to his unique investment style known as value investing. He learned it from Benjamin Graham, the father of value investing, in the 1950s when he was a graduate student at Columbia Business School. The Japanese companies Buffet acquired are traditional conglomerates that focus on natural resources and shipping and have extensive business operations around the world. The key risk Mr. Buffet has foreseen could be that U.S. stock markets are expensive in terms of valuations.
Popular American Delusions
Let us look at where U.S. stock markets stand at current valuations. We will use three often-used valuation metrics from the long- and short-term points of view: the ratio of market cap to GDP, Schiller’s P/E, and the forward P/E multiple.
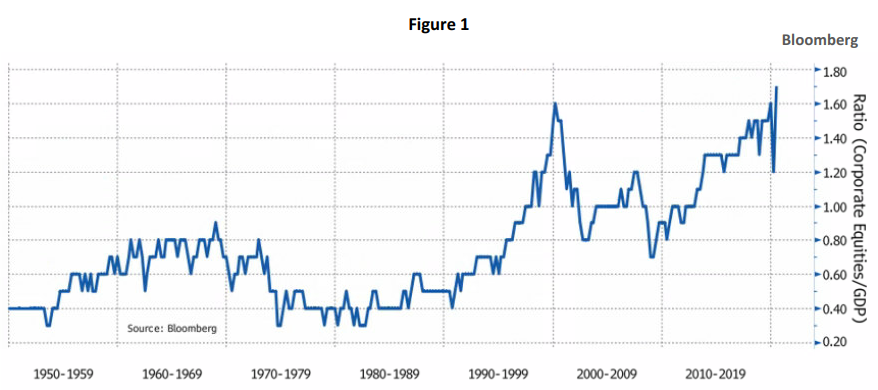
The first metric is the ratio of stock market capitalization to GDP, or the Buffet Valuation Indicator. Warren Buffett, back in 2001, made a remark in a Forbes magazine interview, saying, “The indicator is probably the best single measure of where equity valuations stand at any given moment.” Figure 1 plots the ratio of U.S. non-financial corporate equities and quarterly U.S. GDP through June 30, 2020. The market cap data came from the St. Louis Federal Reserve. The first quarter 2020 reading declined to 1.2 when U.S. equity values plunged sharply. The ratio was down from 1.5 at the end of 2019. The Buffet Indicator jumped during the 2nd quarter, as the broad U.S. markets rallied, and surpassed the peak of the dotcom era to 1.7.
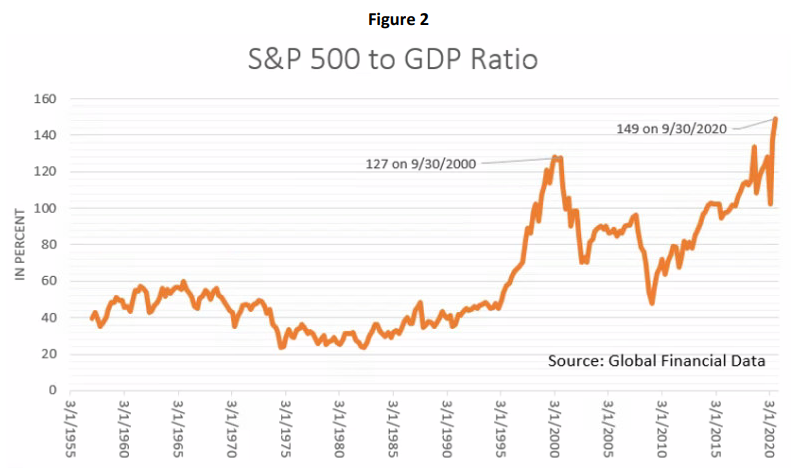
The same metric can also apply to the S&P 500 Index, which consists of the 500 largest U.S. companies and captures about 80% of the total market cap in the US. These market cap data are updated more frequently than the St. Louis Fed data used before. Figure 2 shows the ratio of the market cap of U.S. large companies reached 1.5 times U.S. GDP ending September 30, 2020, 20% higher than the 1999 level.
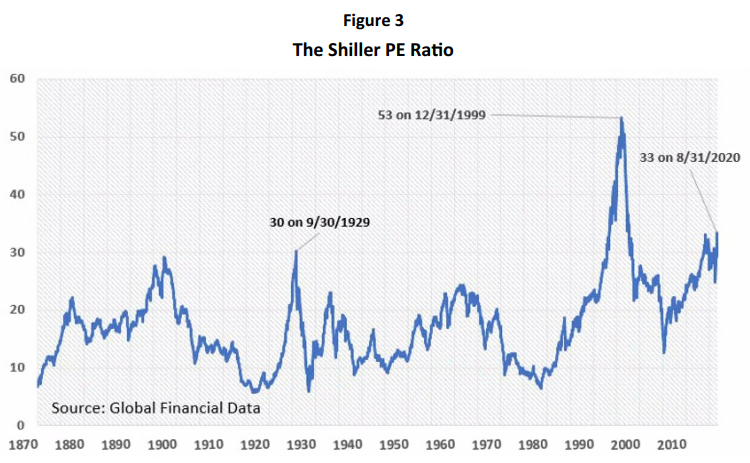
The Shiller PE, or cyclically adjusted price-to-earnings ratio (CAPE), is another long-term market valuation indicator. The ratio takes current stock prices, divided by the average of 10 years of earnings, adjusted for inflation. The measure eliminates ups and downs of corporate earnings during business cycles. This metric also can be used to assess future returns on equities over periods of 5, 10, or 20 years. In the past, we had discussed this correlation in our Mar 27, 2019 blog “Applying Shiller’s CAPE to Today’s Markets”. The finding is that higher Shiller P/E ratios often lead to lower future returns.
Figure 3 shows the ratio, based on the S&P 500 Index. In the past 150 years, there were only three times when the ratios exceeded 30; the prior extremes occurred in 1929 and in 1999. According to Shiller’s PE, the market valuation on the S&P 500 Index was 33 times the Index’s inflation-adjusted earnings as of August 31, 2020. The same chart also shows Shiller PE ratios have been more elevated in the past 20 years, which have averaged around 26 times, as compared to the 150-year average of 17.
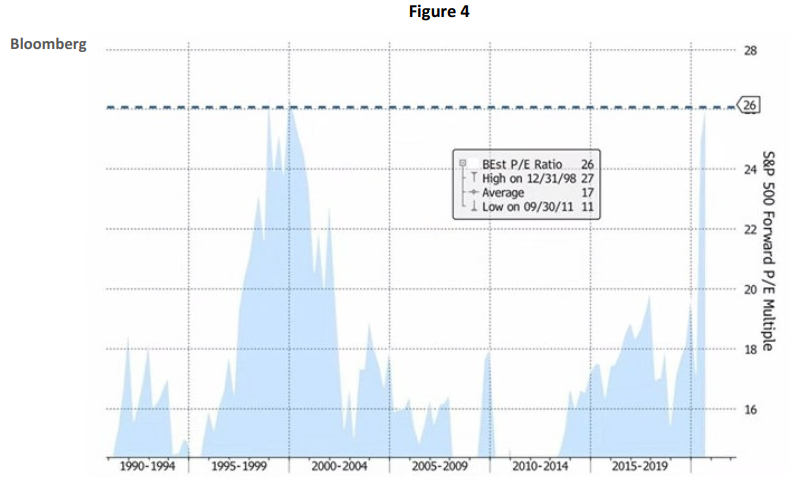
We can assess current market valuations from some forward-looking measure. Figure 4 shows the S&P 500 forward P/E multiple, often used by Wall Street. The Index’s multiple was approaching an all-time high, set on December 31, 1998.
Check and Balance
Mr. Buffet looked abroad and found better values there. Figure 5 shows CAPE ratios among major stock markets, around the world, through September 30, 2020. U.S. equities were twice as expensive as foreign equities.
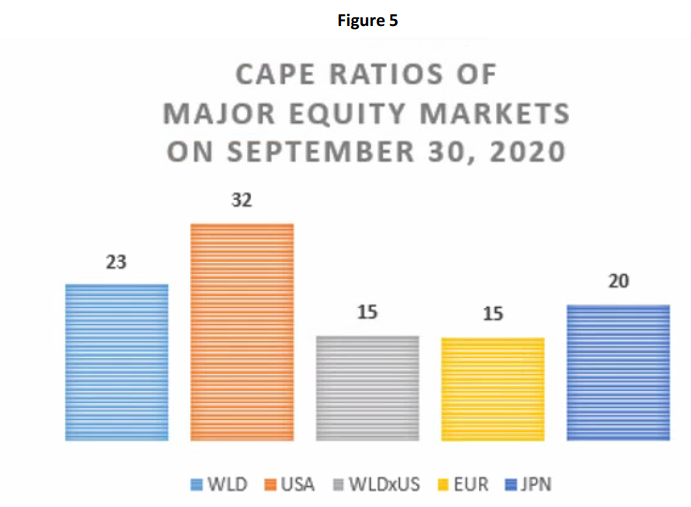
Source: Global Financial Data
The strong performance of U.S. stocks in the past 10 years stifled investors’ interest in non-U.S. equities. We would like to remind investors of the lesson of the Lost Decade, from 2000-2009. It was the period after the dotcom bubble busted. The S&P 500 Index recorded one of its worst 10-year performances with a total cumulative loss of nearly 10%. During this period, the MSCI World ex USA Index gained over 17% and the MSCI Emerging Markets Index surged over 150%.
As the dollar weakened, most U.S. stocks trailed international stocks, while U.S. stocks, tracked by the S&P 500 Index, set fresh records. How could this apparent contradiction occur? The S&P 500 Index, a market cap-weighted index, has been dominated by a handful of high-growth stocks, which contributed to the Index’s market return this year.
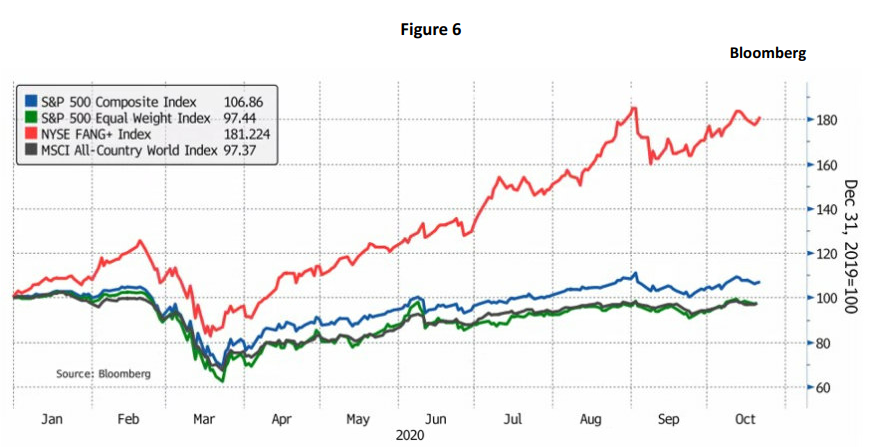
Figure 6 shows the NYSE FANG+ Index, tracking high-growth stocks, skyrocketed, surging over 80% for nearly the past 10 months, and the S&P 500, coming out of a slump, gained 7% for the same period. The latest data suggest high growth stocks account for over 25% of the S&P 500 Index’s market cap. The same chart shows the equal-weighted S&P 500 Index was nearly 3% below its January level, trailing global equities, represented by the equal-weighted MSCI All-Country World Index. What we learned is that except for U.S. high growth stocks, most U.S. stocks in the S&P 500 Index lagged the benchmark.
What will happen over the next 10 years? We do not have a crystal ball to tell you, but Shiller’s PE ratios, based on the 150-year data, suggest that U.S. stock market returns are likely to be poor. Mr. Buffet often says, “If you are not willing to own a stock for 10 years, don’t even think about owning it for 10 minutes.” We believe that he intends to hold his latest investment acquisitions at least for that long.