The U.S. Under Siege Redux
As we ring in 2022, we can't help but feel like we're facing a rerun of the past. We are facing a third wave of COVID-19 called Omicron, unconventional debt and stimulus programs that continue to exacerbate wealth/income inequality, and our most recent inflation dilemma, which could rival the '70s. Although they didn't have to navigate the inflationary risks of today, the Fed's late 2018 tapering actions sparked a market selloff and volatility. While the Fed's actions and government spending bills top the concerning headlines we read today, 2022 is likely to boil down to a few critical themes related to market risk:
Equity and fixed income market valuations (along with real estate and commodities) are highly elevated.
An elimination of ZIRP (zero interest rate policies), the primary reason for our historically low Treasury yields and record tight spreads for corporate and municipal bonds, could add unwelcome stress and volatility.
Geopolitical unrest is boiling as China, Russia, Iran, and other countries and factions seem more confident in wielding their power to test global democratic unity.
Although some of these themes and their effects are impossible to predict, we shall do our best to present some thoughtful historical trends and work towards providing portfolio strategies that could withstand the uncertainty in today's markets.
The Fed and Its Bubble Scorecard
This past December forced the Fed's hand to reverse course on their narrative that inflation was primarily because of the explosive demand of consumers emerging from the pandemic and supply constraint bottlenecks. After six months of steady increases and additional factors such as wages, housing, and energy that have yet to be incorporated into CPI, the probability of higher inflation lingering longer than first expected has increased. Powell and the Fed recognize they are behind the inflation curve with current CPI measures of 6.8% and 10-year Treasury yields at a feeble 1.5%, causing real (inflation-adjusted) yields to go negative by 5.3%. Real yields need to become positive for the Fed to make any headway in fighting inflation. Moreover, the Fed's printing press, stimulus policies, and government deficits will probably have a longer-lasting effect on inflation. This "supply chain crisis" narrative is the kindling stoking the inflationary fires.
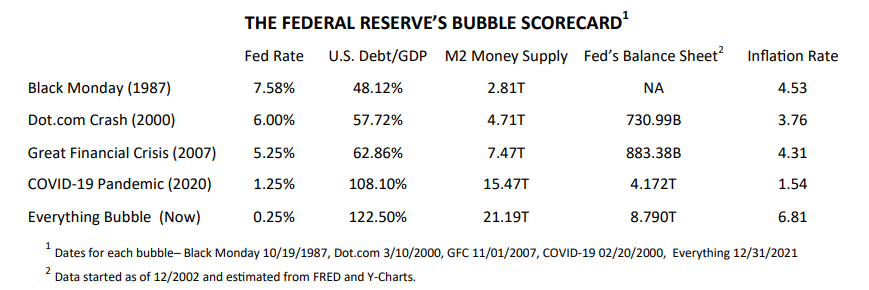
Ever since Alan Greenspan was the Chair of the Federal Reserve, the Fed has implemented faster stimulus programs, the level of interest rates has been lower, and debt, money supply, and Fed's balance sheets have rocketed. If the pattern of past financial crises presented in the Bubble Scorecard persists, our monetary system is running out of runway. Each of these episodes had different causes and policy responses. Still, the rise of central bank intervention in the markets and the overall economy has now reached a point of no return. It will be onerous for the Fed to remove the excess stimulus and not affect the economy.
The Dichotomy of Inflation, Fixed Income, and Gold
Inflation is rising at rates last seen 40 years ago, so why aren't yields and gold prices rising along with it?
Inflation versus Treasury Yields and Gold
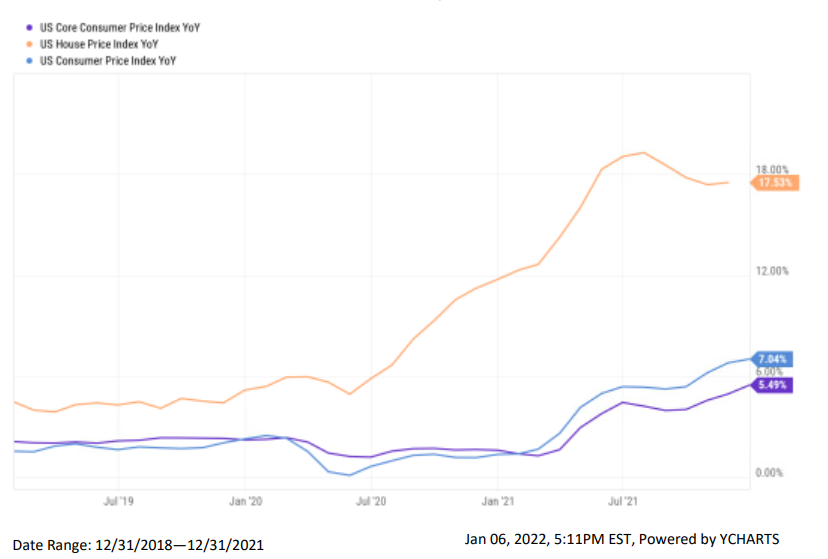
As shown by the 10-year Treasury rate above (orange line), yields have fluctuated in a tight band throughout 2021. Since its peak at $2,067 per ounce in August 2020, gold prices (blue line) have declined, trading in a close range around the $1,800 level. The U.S. Treasury and gold markets have yet to reflect the risk of rising inflation (as shown by the purple line). The Fed has forecast inflation to subside later in 2022 and end the year at 2.6%. But the University of Michigan inflation expectations survey found the one-year expectations at 4.9% and five years at 3.1%, above the Fed's expectations. With only three rate hikes signaled for 2022 and real yields in negative territory throughout 2021, the Fed may struggle to curb inflationary pressures. If the ongoing increases in wage pressures and housing prices coincide with these survey numbers, we expect bond yields and gold prices to rise.
Concentration Risk and Return Compensation
The S&P 500 Index posted 70 all-time closing highs in 2021, ending the year at 4,766 and returning a stellar 28.71%, which easily topped 2020's 18.4% total return after bouncing from the pandemic low of 2,237 on March 23, 2020. We often talk about monetary stimulus and the role of fiscal policies in the stock market's fantastic run. Still, it is essential to understand a couple of other prominent influencers of the market's recent performance: growth stock concentration and buybacks.
These headline numbers mask the "concentration risk" explosion of passively managed index funds. Today, the top 10 constituents in the S&P 500 represent about 30% of the entire index. That's nearly double the 15% position those same companies comprised in 2015 and the highest percentage ever recorded. So how has such a shortlist of companies dominated in just the past six years? These large-cap growth companies have recorded impressive cash flow gains and larger profit margins year in and year out.
But most importantly, they were uniquely positioned to continue delivering earnings growth during the impact of COVID-19. Historically, as a company climbed into the milestone of the top 10 of an index, on average, it experienced outstanding performance. However, after peak exposure, the same company tended to underperform the broad market over the following 10-year period (1) . Morningstar recently conducted a study that supports this conclusion(2).
Percent of Market Return From Largest Stocks

Source: Morningstar Direct. Data is based on the Morningstar US Large-Mid TD USD Index. Data as of November 19, 2021.
*Adjusted average excludes 2011, 2015 and 2018 to remove distortions caused by those years’ market returns.
Morningstar's chart shows the peak return contribution from the largest stocks in 2020 and how that domination waned in 2021. If this trend continues and the returns of the largest stocks decline to their long-term averages, active fund managers should gain an advantage and outperform passive funds.
Concentration risk is especially notable in growth indices, as five stocks make up over 35% of the Russell 1000 Growth, and ten stocks account for more than 50% of the index's 27.6% return this year. The difficulty lies in finding managers that can actively provide value, as Morningstar's research found that only 16% of large growth funds beat their performance index in 2021.
In the rebalancing we conducted in early 2021, we decreased our exposure to passively managed index funds and added active equity managers to reduce exposure to these highly valued stocks.
Towneley recognizes other risks associated with these dominating companies and their exposures, and we plan to continue paring down our index and concentration exposure over time because:
It is nearly impossible to keep up the growth and profits once a company becomes too large.
It will be challenging to keep up with the innovations to meet changing consumer preferences, especially as competitors enter their markets.
A slew of bills recently introduced in Congress seeks to tighten U.S. anti-trust laws and reign in monopolistic behavior by "Big Tech" companies, such as Facebook, Apple, Google, and Netflix.
Although the stimulus and liquidity in the markets have greatly benefited this concentrated group of stocks, we have to acknowledge that index exposure should not be conflated with diversification. This market environment encourages us to step away from the higher volatility these stocks are likely to incur and look to active managers whom we believe can deliver better risk adjusted returns.
Companies buying back their stock has been one of the main drivers of stock market performance over the last couple of years. For example, in the third quarter, corporate stock buybacks hit a record high, as the chart below represents, and there seems to be a high degree of correlation between the Fed's balance sheet, stock buybacks, and the rise of the S&P 500.

Source: Buybacks: Howard Silverblatt, S&P Dow Jones Indices
Balance Sheet: St. Louis Fed
S&P Prices: Morningstar
The lack of investment opportunities, high piles of cash from profits, and low interest rates have combined to make the past 12 years a buyback bonanza. So it isn't surprising to see the same companies that make up the "concentration" list discussed above when you investigate who is benefitting the most. Of the FAANGMs (Facebook, Apple, Amazon, Netflix, Google, and Microsoft), only Amazon and Netflix are missing in S&P's top 20 list below. But it is always a great learning experience to take a page from Warren Buffett's playbook regarding Berkshire Hathaway's buyback program as he has been both a "defender" and "critic" of these actions.

With over $149 billion in cash at the end of the third quarter, Berkshire Hathaway has found no other higher returning investments than its company stock and is employing a majority of its operating profits to buy more. At 2021's pace, the company is on track to surpass last year's record of $24.7 billion in buybacks, contributing to its 29.57% return for the year. Berkshire has been a net seller of its other stock holdings over 2020 and 2021 and hasn't made a significant acquisition since 2016. This buyback program started in 2011 (the Fed's balance sheet rose from less than $1 trillion in November 2008 to $4.4 trillion in October 2014). Given the Fed's trepidation to end its stimulus programs, buybacks are Berkshire Hathaway's only alternative.
Our Berkshire example hopefully explains how the Fed is providing the fuel for these buyback activities and, in essence, has become the controller of the markets. Fundamental and relative value investors like Buffett cannot operate until they turn the liquidity spigot off and financial markets behave independently. Towneley recognizes that buybacks are likely to continue contributing to returns as large amounts of cash remain on the sidelines. But, as the graph below shows, these buyback programs have accounted for about 40% of S&P 500's returns since 2011.
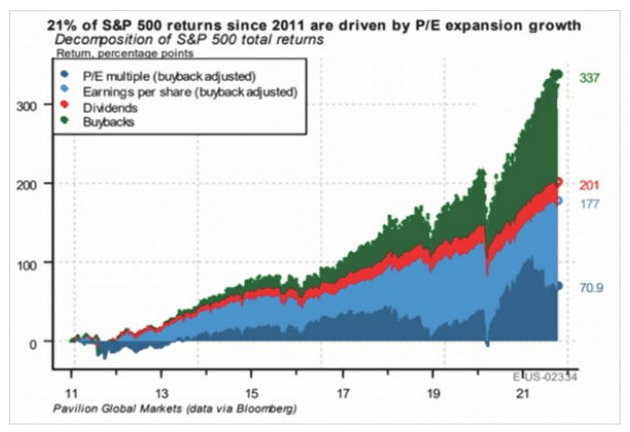
Source: Aidan Garrib of PGM Global
Domestic v. International Equity Markets
In most client meetings, we discuss the 2.4 times overweight in domestic equity compared to international equity allocations and how the relative performance has tilted tremendously towards domestic stocks over the past decade. But, once again, we are believers in diversification, and if we were to use the MSCI ACWI (All Country World Index) as a guide in how global stock markets are weighted, we would notice the following (3):

Source: MSCI ACWI Index (USD) | msci.com
From this chart, U.S. domestic equity weightings versus international markets would be closer to 1.60 times, so our strategic allocation has been 0.8 times greater than the general market. We're researching the possibility of tactically increasing international exposure soon.
What has been causing such dispersion in returns that have allowed U.S. equity markets to dominate over this long period?
Domestic vs. International - 5 Year Rolling Returns
January 31, 1975 - December 31, 2021

Source: Morningstar and Global Financial Data Inc.
Analysis of the chart above suggests that we would expect a mean reversion (4) between the two asset classes, during which international equities find their day in the sun. Since 1975, the out-performance of one asset class over the other has lasted an average of seven to eight years. The current out-performance of domestic equities is now well past the average and is approaching 11 years. As a result, many believe it is time to transition to fair competition. However, many factors can affect the long-term performance of domestic versus international investment performance:
1. Country/Political Risk
2. Central Bank Monetary Policy
3. Economic Growth Prospects
4. Currency Expectations
5. Sector/Industry Exposure
6. Taxation
The extended-out performance in this current cycle is primarily attributed to 1) the high concentration of large growth stocks dominating U.S. markets, 2) the higher correlation of international companies that possess value-like characteristics and have been out of favor, 3) emerging countries like China and Latin America that have been exposed to significant changes in political agendas, and 4) the relative strength of the dollar which resulted from a more robust U.S. economy.
The U.S. economy continues to attract foreign capital that offsets trade deficits. Although the U.S. dollar has been the cornerstone of global economic activity and international trade, there have been repeated warnings that the dollar may slide from its place at the top of the global currency heap. With soaring U.S. deficits, the U.S. may not be as supportive of the dollar because a weaker dollar means the U.S. would cut the costs of paying back the debts. The safe haven and kingpin status seems to be slowly slipping away as alternatives, such as the evolution/acceptance of digital and cryptocurrencies, rise.
What are some of the key reasons for implementing an increase in international equities?
1. Opening economies in a post-COVID world could encourage globalization efforts, benefitting both internationally developed and emerging countries.
2. U.S. equities have bounced back faster than other countries, which has resulted in extremely high valuations versus markets abroad.
3. Liquidity - If the Fed is disciplined in turning off the liquidity spigot, the dominance of U.S. equity markets should wane.
4. International stock markets are more value-oriented and not as exposed to the domination of the FAANGMs here in the U.S.
5. Given the broader spectrum of companies across the globe, greater opportunities will be available for active managers.
6. The dollar's direction seems to have reached a plateau and may weaken in the intermediate future.
Foreseeing any of these expectations is difficult, but these are just a few examples that could spark the onset of a reversion to the mean in performance, allowing international stocks to rise and enhance the diversification of U.S. investor portfolios.
From meme stock investing, cryptocurrencies, ESG, thematic trends, and the new craze of the metaverse, the conclusion of 2021 felt a lot like the dot.com bubble. Although the dot.com crash resulted from speculation in internet-related companies who never earned a dime, our current environment is flush with cash from the stimulus and fiscal programs. These stimulus programs helped us through the 2020's pandemic shutdown. However, the provided liquidity has created many bubbles across the spectrum. In a deflationary world, you can pay almost any price for future growth. But when inflation rages to where the Fed must act, current cash flow takes precedence, not the 10, 20, 30 years of discounted cash flows accounted for in some of these large-cap growth stock valuations. Moreover, the overshoot of traditional markets has spurred vast innovations in the investment world that garner the attention of those most capable of incurring the losses associated with such speculation. Will these innovations simulate those of the dot.com bubble?
No one knows how the stock market will perform over the next 12 months, but we expect volatility in the market to remain elevated. We design and manage your portfolio at Towneley based on your appropriate risk and investment horizon to help you navigate challenging market environments. Diversification is a critical principle in these difficult times, and we are here to help if any questions arise. Please let your portfolio manager know if anything in your life has changed or is about to change that may impact your portfolio's asset allocation or your financial plan.
(1) Dimensional (12/31/20) — Using data from CRSP, the largest stocks are identified at the end of each calendar year by market capitalization. Compared to the Fama/French Total US Market Research Index.
(2) The FAANG Market Is Fading, Morningstar Market Update, Lauren Solberg, Tom Lauricella, December 1, 2021.
(3) MSCI ACWI Index (USD) factsheet as of November 30, 2021. The MSCI ACWI captures large and mid-cap representation across 23 Developed Markets (DM) and 27 Emerging Markets (EM) countries. With 2,976 constituents, the index covers approximately 85% of the global investable equity opportunity set.
(4) Wikipedia, Mean Reversion- In finance, the term "mean reversion" has a slightly different meaning from "return or regression to the mean" in statistics. Jeremy Siegel uses the phrase "return to the mean" to describe a general principle, a financial time series in which "returns can be very unstable in the short run but very stable in the long run." Quantitatively, the standard deviation of average annual returns declines faster than the inverse of the holding period, implying that the process is not a random walk. Instead, those periods of lower returns are followed by compensating periods of higher returns, such as seasonal businesses.