Fed Up With The Fed
At the close of 2019, we lost one of the greatest Fed chairmen: Paul Volcker. Martin Wolf of the Financial Times described Volker as a man with the highest degree of moral courage, integrity, sagacity, prudence and devotion to the service of the country. Chairman Volker believed in good government, international cooperation, fiscal discipline, sound monetary policy and a Federal Reserve that was servant, not master, of the economy. Volcker was not afraid of criticism; he did what was sound and reasonable to stave off an inflationary period that was crippling the U.S. economy during the 1970-80’s.
While we appreciate the new “whatever it takes” approach current Chairman Powell and his most recent predecessors have taken to extend the current expansionary cycle, we are also concerned that the integrity and prudence that Chairman Volker demonstrated are no longer valued by our central bankers. The actions of today’s Fed seem to be very short-sighted, reactive instead of proactive, and reflect little concern for the economic quagmire that unmitigated monetary stimulus is creating for future generations.
Growing Income and Wealth Inequality in the U.S.
Census data show that from the 1940s until the 1970s, family incomes across the spectrum grew at nearly the same pace. However, income disparities began to widen during the 1970s, with higher incomes growing much faster than middle and lower incomes. From 1979-2007 (before the Great Recession), Congressional Budget Office (CBO) data show that average income (after transfers and taxes) rose 226% for the top 1% of income earners, 85% for the bottom 20%, and only 47% for the middle 60% of income earners. The Center on Budget and Policy Priorities attributes the seemingly illogical lower 20% increase to two changes in CBO policy: one in 2012 affecting how the CBO values government provided health insurance, and the second in 2018 when the CBO changed the income measure it uses to rank households. Both of these changes “strongly affect income trends for the poorest households, substantially raising the level and rate of growth of their measured income.”i
Income Gains Widely Shared in Early Postwar Decades—But Not Since Then
Real family income between 1947 and 2018, as a percentage of 1973 level
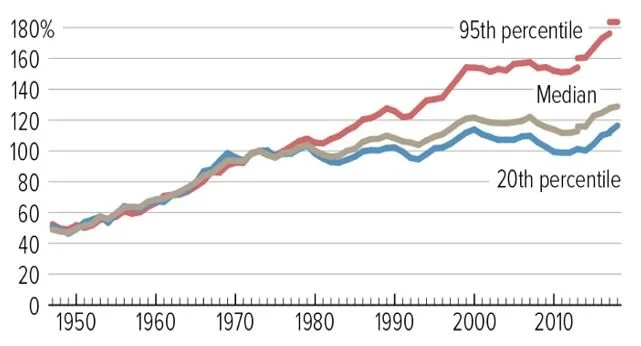
Note: Breaks indicate implementation of a redesigned questionnaire (2013) and an updated data processing system (2017).
Source: CBPP calculations based on U.S. Census Bureau Data
Center on Budget and Policy Priorities | CBPP.org
Not surprisingly, after tax incomes fell sharply across the board in 2008 and 2009 but have partially recovered. Although below its 2007 peak, the average income (after taxes and transfers) of the top 1% of households from 2009-2016 was nearly 5 times that of the middle 60%, and 2.5 times that of the bottom20%. The distribution of wealth (asset ownership) is even more highly concentrated at the top than is income and has been increasing since the 1980s.
Wealth is Even More Concentrated Than Income
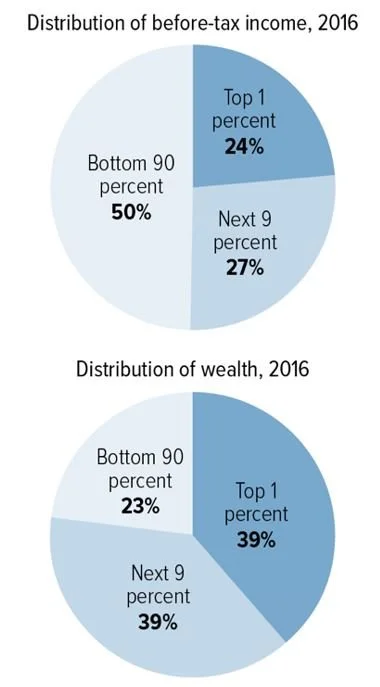
Note: Percentages may not add to 100 percent due to rounding.
Source: Survey of Consumer Finances 20017
Center of Budget and Policy Priorities | CBPP.org
Data from the Federal Reserve’s Survey of Consumer Finances (SCF) is the main official source of data measuring the distribution of household wealth since 1989. As the following chart illustrates, since 1989, the share of wealth held by the top 1% has increased, while the share held by the other groups, has decreased.
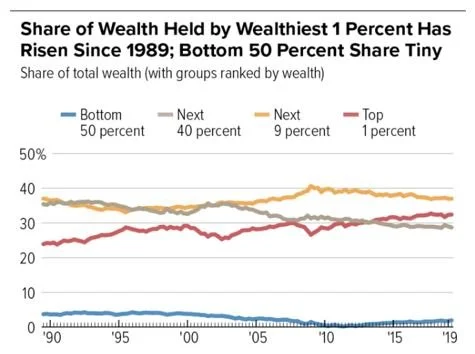
Source: Congressional Budget Office
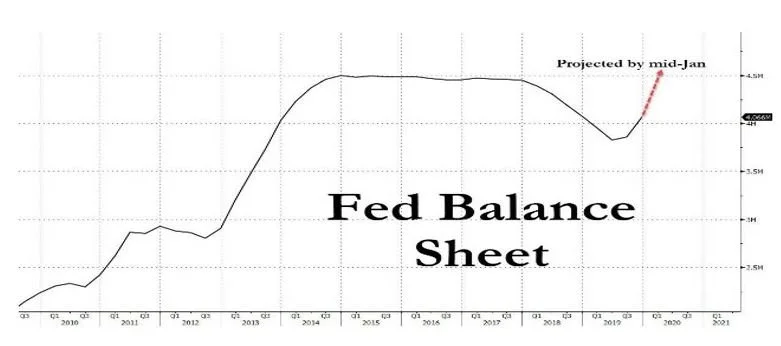
Recent Fed monetary policies are contributing to the inequality of income and wealth. This past quarter, the Fed resumed pumping billions of dollars (some estimates are as high as $500B) into the financial system in reaction to a mid-September tumult in the repo market (Repurchase Agreements) that caused the overnight funding rate to spike. This latest round of quantitative easing (called QE lite), as in the past, has been accompanied by rising stock prices. In a Wall Street Journal article, Mr. Powell, you called this latest round of balance sheet expansion an “adjustment” and not stimulus, although the effect has been the same. Money that might have been invested in the real economy is instead flowing into an already significantly overvalued stock market.
As the Fed’s balance sheet has expanded, the S&P 500 Index has grown at almost the exact same pace. Rising stock prices primarily increase the wealth of the wealthiest households that already own the majority of the stocks traded on US exchanges. In a National Bureau of Economic Research Working Paper,[ii] using data and calculations from the Federal Reserve Board’s Survey of Consumer Finances, Edward N. Wolff charted the percentage of total stocks owned by the top 10% of households from 1983 to 2016. During these years, that percentage ranged from a high of 89.7% in 1983 to a low of 76.9% in 2001. As of 2016, the top 10% owned 84% of the total stocks traded on U.S. exchanges.[iii] As the U.S. stock market has continued to rise over the past three years, driven in part by the Fed’s quantitative easing, the top 10% have continued to benefit to a much greater extent than have the bottom 90% simply due to their larger share of the market.
By holding the federal funds rate at zero from 2008-2015, the Fed further encouraged those with the most disposable income to invest in the stock market, rather than in savings accounts or CDs. These bank products, formerly a safe haven for lower income savers and retirees, paid virtually nothing during these 7 years and, on average, are still well below a 0% real return. At the beginning of 2008, the average 1 year CD paid 2.42% APY according to BankRate.com. By September 1, 2009, the national average 1-year CD APY had dropped below 1% and is currently at 0.76%. According to data from the FDIC, the average savings account rate dropped from 0.21 to 0.06 between January 2010 and July 2013, and it remained at 0.06% through January 2018. Since then the national average savings account rate has risen slightly to a mere 0.09%.
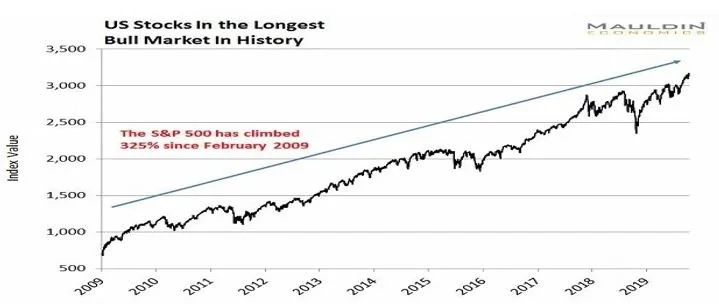
© Mouldin Economics
Source: Thomson Reuters
If income and wealth inequality is not curtailed, long-term effects can negatively affect people at both ends of the income and wealth spectrums. As the Washington Post reported last year[iv], several studies suggest that income inequality depresses economic growth. Economic growth is harmed by lower per capita income, declining health and well-being and lower disposable income which both impacts consumption and may entice middle-class individuals to incur debts they can't pay. At the lowest income levels, fewer education opportunities are available to children, which hampers their ability to develop skills and move up the socio-economic ladder. As a result, these children become less productive, lower paid workers. Those at the top of the income scale are also harmed as fewer lower and middle class consumers are able to afford to purchase goods and services.
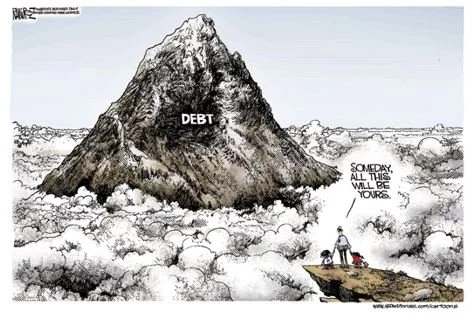
Dangerous level of national debt
The Federal banking system was created in 1913 to provide a safer, more stable monetary and financial system. The Fed’s primary goals are to achieve maximum employment, moderate long-term interest rates and stable prices, and its primary tool is short-term interest rates. Fed policy is intended to be prospective in nature in response to changes in the economic outlook, not reactionary. The Fed was not created to mint money whenever economic instabilities arise nor to maintain a huge amount of debt to prop up the stock and bond markets.
For the past decade, global financial markets have been influenced by central bank intervention. An estimated $14 trillion has been minted globally since the financial crisis of 2008. Despite being in a recovery mode for the past ten years, the majority of global central banks are again flushing their economies with liquidity. For the fiscal year ended September 30, 2019, the U.S. Treasury Department reported our budget deficit exceeded $1 trillion. By December 31, 2019, the end of the first quarter of the U.S.’s 2020 fiscal year, the cumulative deficit has grown by $357 billion which, if this growth rate continues, means the deficit will reach $1.4 trillion by the end of the current fiscal year.
The last time our deficit was this high was during 2011 and 2012, when the Obama administration incurred over $1 trillion in debt in response to the financial crisis, and the economy was still climbing out of a deep recession. After legislators agreed to cut spending and let some tax cuts expire, the deficit began to decline. That was almost a decade ago. What’s different today is we have a strong economy and we’re nearing a peak after which a decline is inevitable and some say, recession is likely. However, because the Fed has already used all the weapons in its arsenal, when the downturn happens, there is nothing left except to go to a negative interest rate policy. We discussed the dangers and shortfalls of negative interest rates and Modern Monetary Theory in last quarter’s newsletter.
Rising labor costs
As of the Bureau of Labor Statistic’s most recent report, unemployment stood at 3.5% (a 5-year low). Although two hundred and sixty-six thousand (266,000) jobs were created in November, as the chart below illustrates, the purchasing power of the average hourly wage has only increased 10% in the last 40 years. Also, despite November’s gains (which include the return of 40,000 striking GM workers), job growth is slowing. An average of 180,000 jobs were added per month through November 2019, compared with an average of 223,000 jobs per month in 2018.
Americans’ paychecks are bigger than 40 years ago, but their purchasing power has hardly budged
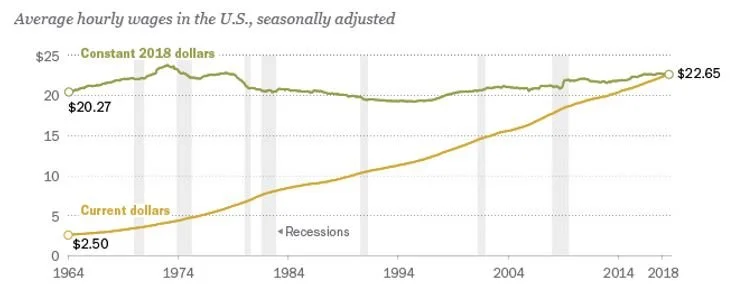
Note: Data for wages of production and non-supervisory employees on private non-farm payrolls. “Constant 2018 dollars” describes wages adjusted for inflation. “Current dollars” describes wages reported in the value of the currency when received. “"Purchasing power” refers to the amount of good or services that can be bought per unit of currency.
Source: U.S. Bureau of Labor Statistics.
PEW Research Center
Until recently, only the highest paid tier of workers received wage increases, which further contributes to the inequality of income and wealth, discussed above. According to a December 22, 2019 Pew Research report, weekly wages for the lowest 25% of tiered workers have risen just 4.3% (in real terms) since 2000, but, weekly wages for those in the top 10% rose 15.7%: nearly 5 times the average weekly wages earned by the bottom 10% of workers. Lately, signs have appeared that indicate the average American’s income is rising. A recent Wall Street Journal article claims that wages for typical nonsupervisory employees who make up 82% of the workforce are rising at the fastest rate in a decade (4.5% in November year-over-year for this workforce population).
Rising labor costs are a lagging indicator, suggesting that the economy may be slowing, and that inflation may lie ahead. Employers usually pass rising employment costs on to consumers, however, some may instead look to cut those costs by replacing humans with computers, as some companies, like McDonalds, are already doing.[v] Some economists have concluded that the use of automation explains the decline in the share of national income going into workers’ paychecks over the last three decades.[vi] There are many “pros” and “cons” to automation and its effect on the economy, but it is changing the nature of work and pushing workers without a college degree out of productive industries like manufacturing and high-tech services, and into jobs with meager wages and no prospect for advancement.
Despite some indication that wages are rising for the lowest paid workers, the percentage of economic output that accrues to workers as compensation has declined overall since 1947, with 75% of the decline in the U.S. occurring since 2000. This decline raises concerns about slowing income growth, income inequality, and loss of consumer purchasing power.
Stock Buybacks
Recent fiscal and monetary policies have hugely benefited corporations as the expense of low- and middle-income America. Fueled first by tax incentives provided by the Tax Cuts and Jobs Act, stock buybacks during the first three quarters of 2018 exceeded buybacks in all of 2017 by almost 53%. Instead of investing windfall profits back into their companies in the form of R&D (research and development), employee training, and growth prospects, senior corporate executives chose to benefit themselves, at the expense of employees and long-term shareholders. Corporations benefit from share buybacks because fewer outstanding shares increases earnings per share. While shareholders may benefit from buybacks in the form of higher stock prices, one study found this benefit to be short-lived and that share buybacks actually harmed long-term shareholders.
During 2018, corporations bought back a record $806B in shares, and estimates put the total for 2019 at $700B. A significant portion of equity returns in 2019 were driven by stock buybacks, which historically rise in tandem with the Fed’s liquidity efforts. Stock buybacks do not contribute to production or earnings, other than to artificially inflate earnings per share. To the extent that the Fed’s policies have contributed to the rash of corporate stock buybacks, they are further fueling income and wealth inequality in this country.
Real corporate earnings have actually been declining. As reported by Chris Matthews of Market Watch last September, BEA data indicates that “corporate profits, after adjusting for inventory valuation and capital consumption, are 3.6% below their peak in 2014, while S&P 500 (SPX) earnings are on pace to rise nearly 40% between 2014 and the end of (2019), according to Fact Set.”[vii] Matthews quotes Ed Clissold, Chief U.S. Strategist at Ned Davis Research: “Earnings quality is among the lowest of the expansion and consistent with late cycle behavior by management teams.” Clissold noted that the second quarter 2019 earnings cycle reflects the 8th widest spread between earnings based on GAAP (Generally Accepted Accounting Principles) and reported earnings, and he cited corporate share repurchases as another reason for the divergence between earnings per share and corporate profits.
Conclusion
The Fed’s recent policies have had such a large impact on the U.S. stock market that investors are now evaluating the Fed’s next move instead of the market’s fundamentals. For the stock market to have long-term viability as a place to invest, we need to return to these fundamentals, and real corporate earnings must again become a basis for sound investment decisions. As the Fed’s open market and interest rate policies fuel stock market growth, higher wages at the top and corporate buybacks, they contribute to the growing income and wealth inequality in this country. We need a Fed that is willing to carry out its mandate to act independently and to ignore political pressure. We need Paul Volker.
[i] Center on Budget and Policy Priorities, A Guide to Statistics on Historic Trends In Income Inequality, Appendix, by Chad Stone, Danilo Trisi, Arloc Sherman and Jennifer Beltran, Updated 1/13/2020, Accessed 1/28/2020. https://www.cbpp.org/research/poverty-and-inequality/a-guide-to-statistics-on-historical-trends-in-income-inequality
[ii] Household Wealth Trends in the United States, 1962-2016: Has Middle Class Wealth Recovered?
Edward N. Wolff, National Bureau of Economic Research Working Paper 24085, http://www.nber.org/papers/w24085, accessed 1/29/2020.
[iii] Ibid. p. 34, Figure 15.
[iv] The Washington Post, How Rising Inequality Hurts Everyone, Even the Rich, by Christopher Ingraham, February 6, 2018, https://www.washingtonpost.com/news/wonk/wp/2018/02/06/how-rising-inequality-hurts-everyone-even-the-rich/, accessed 1/29/2020.
[v] Forbes, McDonalds Says Goodbye Cashiers, Hellow Kiosks, by Ed Rensi, July 11, 2018, https://www.forbes.com/sites/edrensi/2018/07/11/mcdonalds-says-goodbye-cashiers-hello-kiosks/#54b60cbc6f14, accessed 1/29/2020.
[vi] Brookings Papers on Economic Activity, BPEA Conference Drafts: Is Automation Labor-Displacing: Productivity Growth, Employment, and the Labor Share, by David Autor, MIT, Anna Salomons, Utrecht Univ., March 8-9, 2018.
[vii] Market Watch, Investors Beware: Corporate Profits are Lower Today than in 2014, by Chris Matthews, September 26, 2019, accessed 1/29/2020.