
Highlights
Resilient growth and rising corporate profits offset geopolitical tensions and energy shocks.
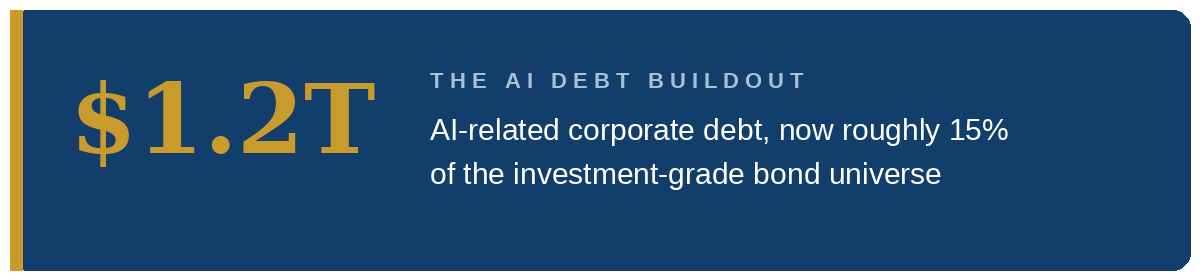
AI spending now being funded largely by new debt issuance at roughly $1.2 trillion, or 15% of the investment-grade bond universe.
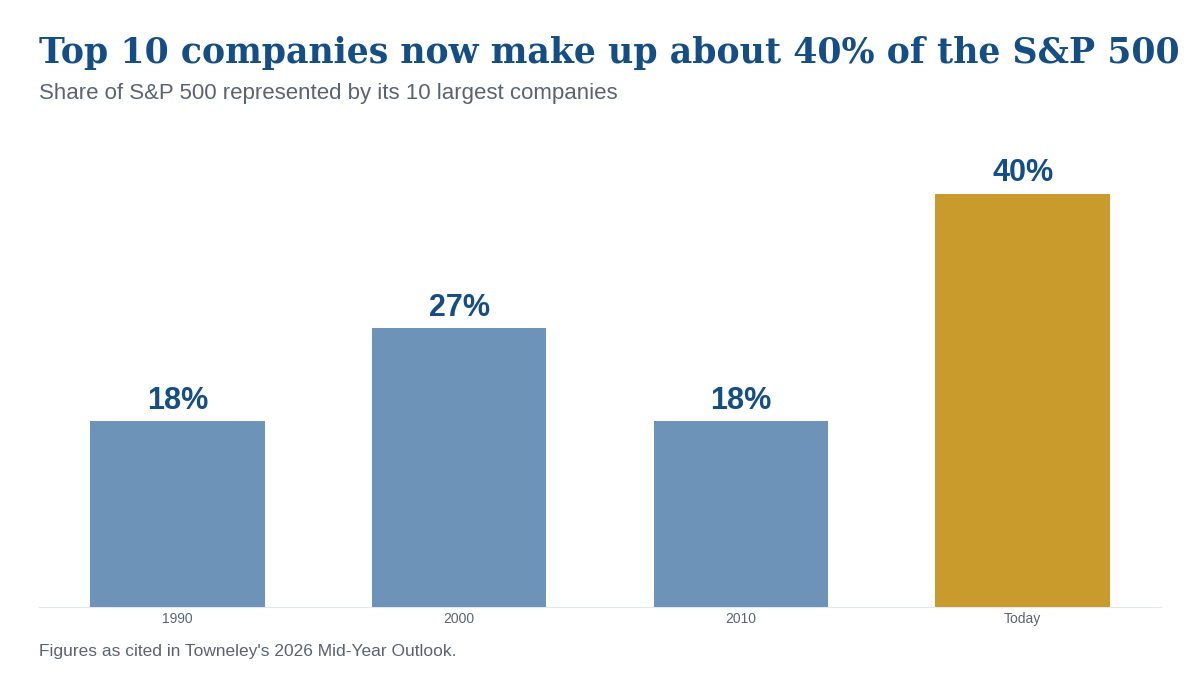
The top 10 companies account for approximately 40% of the S&P 500, near record concentration.
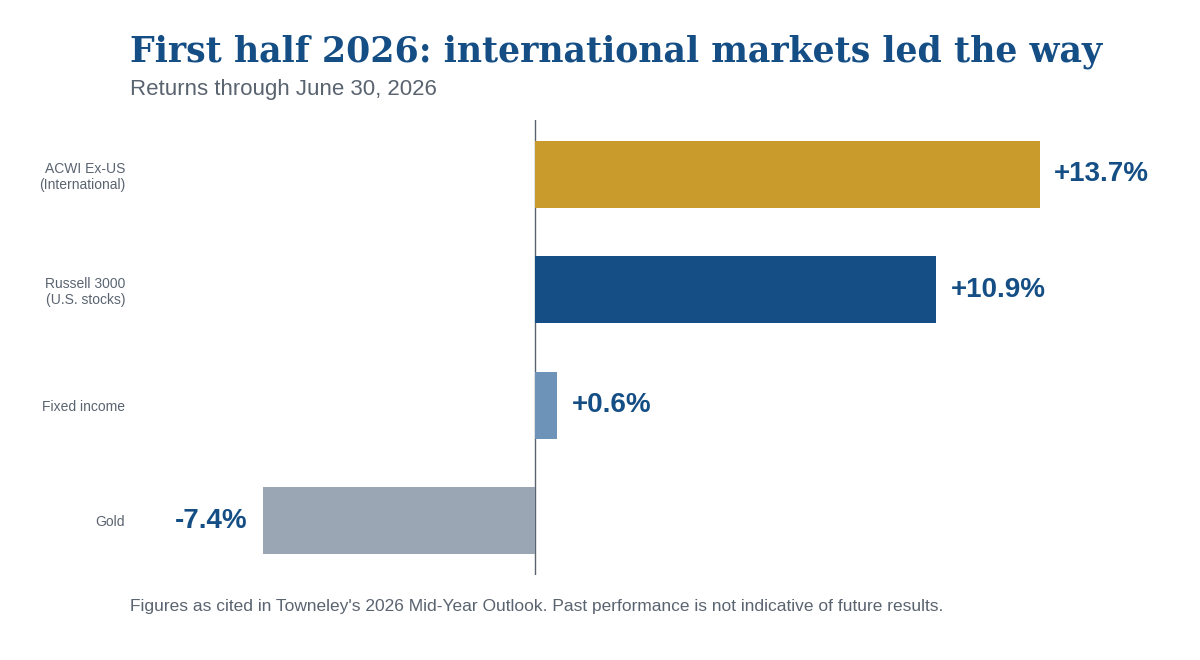
International markets led the first half, with the ACWI Ex-US up 13.7% versus 10.9% for the Russell 3000.
Portfolios remain positioned to benefit from AI while managing concentration risk through value tilts, active managers, international equities, and gold.
The first half of 2026 in review
The first half of 2026 was marked by resilient economic growth and rising corporate profits, which offset geopolitical tensions and the inflationary energy shock from the war in the Middle East. Large-scale investment in artificial intelligence continued to support market sentiment and economic growth, but the viability and duration of that investment are now in question.
With the Magnificent 7's share of the market still near all-time highs, a second concentration risk is building in the corporate debt market. AI capital spending has driven a surge in corporate debt issuance, and AI-related debt now stands at $1.2 trillion, roughly 15% of the investment-grade bond universe. What hyperscalers once funded from free cash flow is now largely funded by debt and equity issuance.
Borrowing and dilution to fund the buildout is a different dynamic than the past three years, and it warrants greater investor scrutiny. The market's focus is shifting from growth potential to demonstrated return on investment. That shift adds risk and can change the AI narrative quickly.
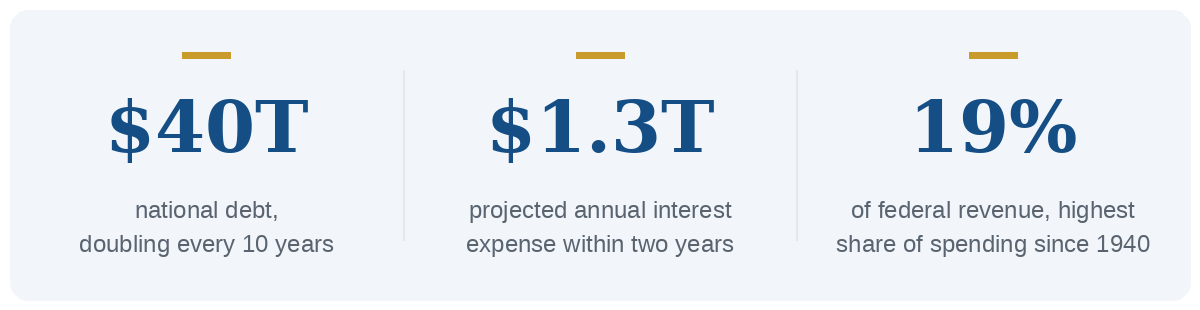
As we have noted in previous outlooks, the U.S. debt picture continues to worsen. Since 2000, the national debt has doubled every 10 years, and it is quickly approaching $40 trillion. With half of government debt coming due in the next three years, higher interest rates will drive a sharp rise in interest expense, which is expected to reach $1.3 trillion within two years.
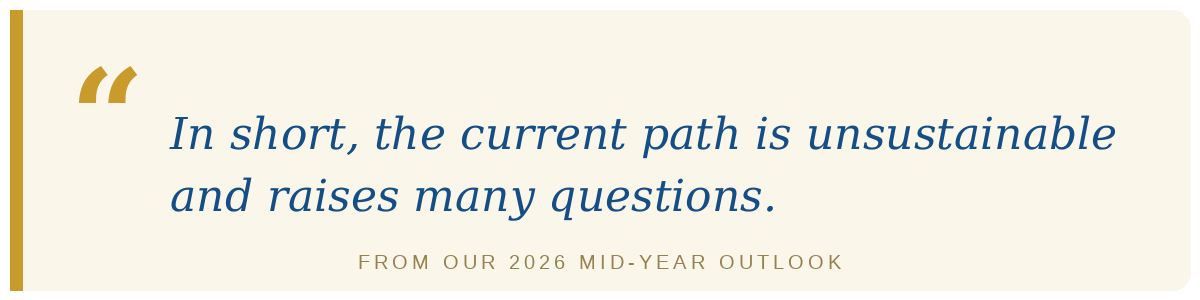
That would surpass the cost of entitlements and defense spending and consume 19% of federal revenue, the highest share since 1940. In short, the current path is unsustainable and raises many questions, particularly for fixed income positioning and equity valuations.
Positioning
The top 10 companies in the S&P 500 now account for roughly 40% of the index, compared with 18% in 1990 and 2010 and 27% in 2000. We believe the right positioning, including the right active managers, matters more than ever. Roughly half of our equity allocation now sits with active managers, up from 20% five years ago. That decision coincided with a small value tilt in our U.S. equity strategy, a 30% allocation to international equities, and an underweight in corporate fixed income.
From an asset class perspective, we are allocated as follows:
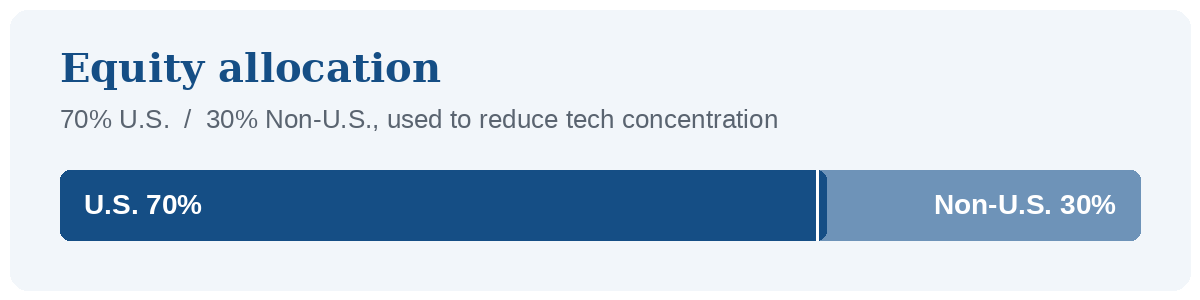
Equities: 70% U.S. and 30% non-U.S. Beyond the benefits of diversification, relative valuations abroad are compelling, and the non-U.S. allocation reduces tech concentration.
Fixed income: With sticky inflation and elevated budget deficits, we are keeping interest rate exposure modest. The taxable portfolio's duration is 1.3 years shorter than the broad market index. We see merit in owning longer-term bonds and will continue to reassess.
Gold: After gold's sharp run from 2023 to 2025, prices are consolidating. We view this as a healthy reset and still believe in the long-term case for owning gold.
Macroeconomic overview
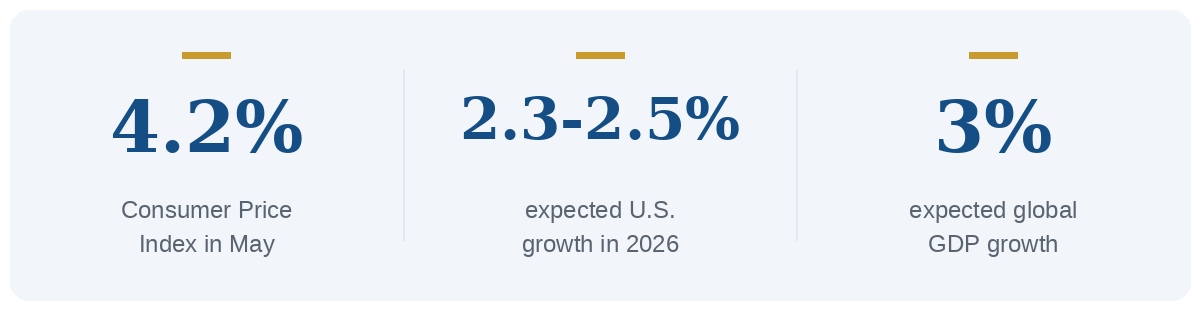
Interest rates and inflation: The war in the Middle East pushed consumer prices higher, with the Consumer Price Index reaching 4.2% in May, led by a 23.5% year-over-year increase in global energy prices. Higher inflation has reduced expectations for Fed rate cuts and left the Fed in a difficult position, managing inflation while trying to avoid overly tight policy.
Growth: The U.S. economy is expected to grow 2.3% to 2.5% in 2026, with global GDP expected to reach 3%, driven by the AI buildout.
Labor market: The labor market has settled into a low-hire, low-fire equilibrium. Unemployment has remained stable, and wage growth has slightly outpaced inflation.
Market performance
Index returns: The Russell 3000 ended a volatile first half up 10.9% through June 30. International markets, measured by the ACWI Ex-US, gained 13.7%, once again outperforming the U.S. market. Fixed income returned 0.6% despite the higher-rate environment. Gold declined 7.4% after large gains over the past three years.
By sector, Industrials, Technology, and Energy led the rally in the first half:
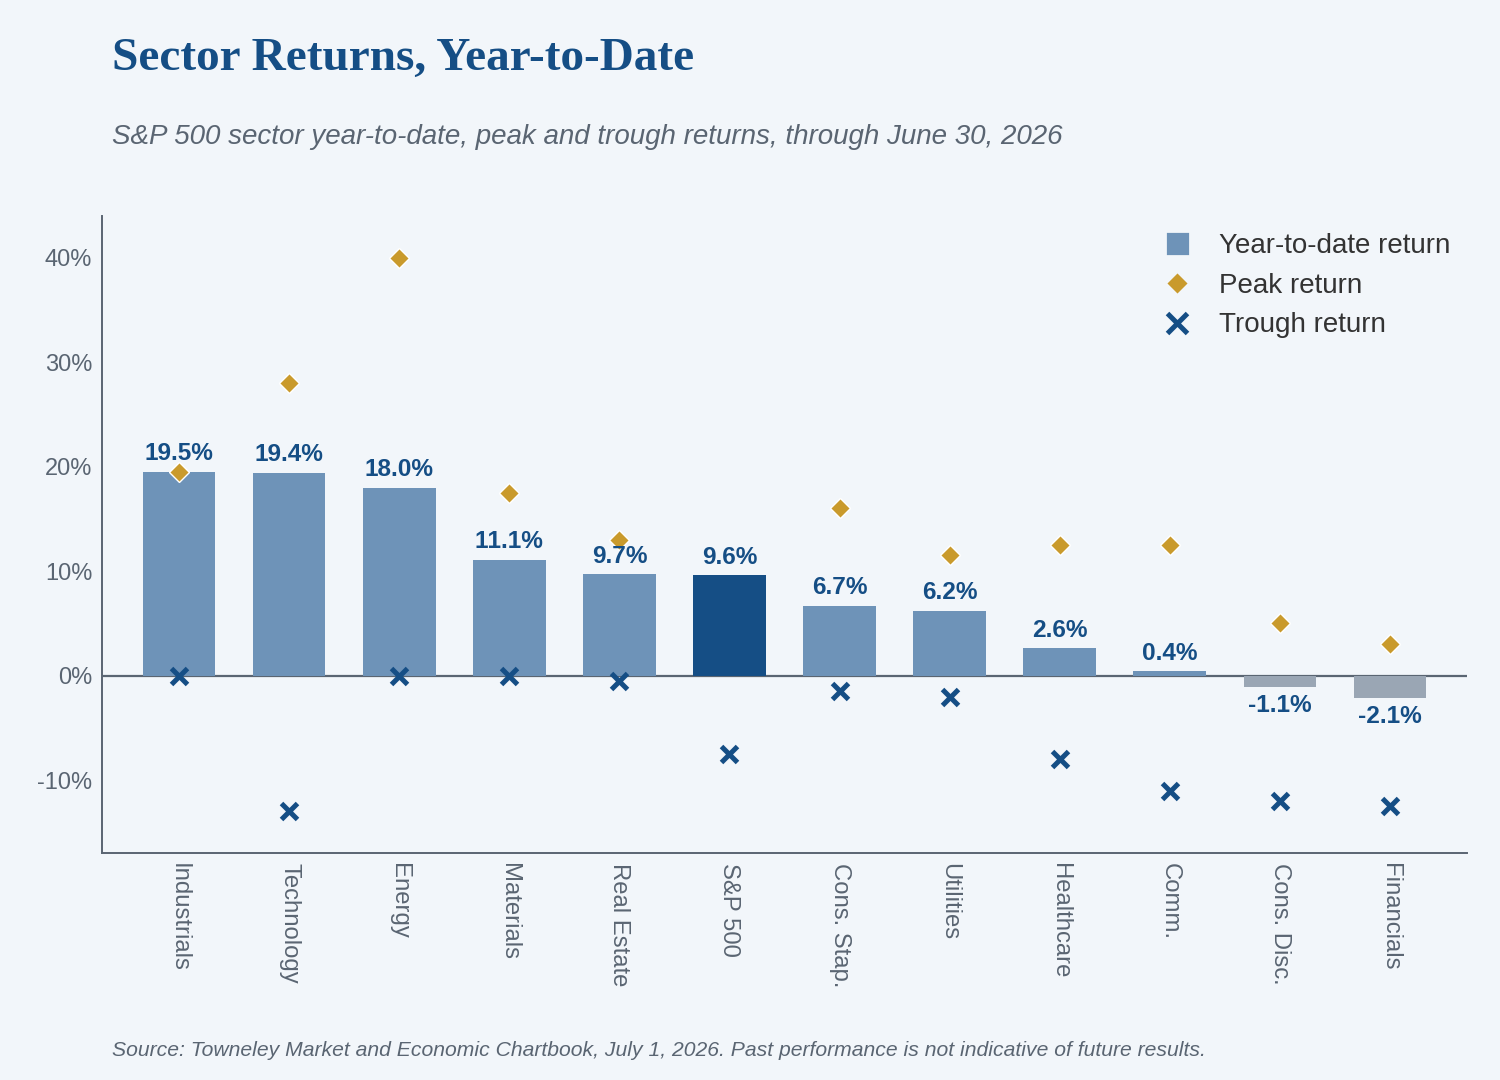
Sources: Clearnomics, Standard & Poor’s, LSEG. ©2026 Clearnomics
Industrials: Industrial stocks rose on heavy corporate and government spending. Three major contributors: the AI buildout, investment in energy to meet the demands of new technology, and rising defense spending amid conflict in the Middle East.
Technology: The tech rally was powered by the ongoing boom in AI infrastructure spending. Companies making critical hardware, memory, and storage saw their shares climb as hyperscalers raced to build the data centers powering modern computing.
Energy: The energy sector benefited from the conflict in the Middle East, led by disruptions in the Strait of Hormuz. Higher crude oil prices lifted profits for drillers and providers.
Investment outlook and considerations
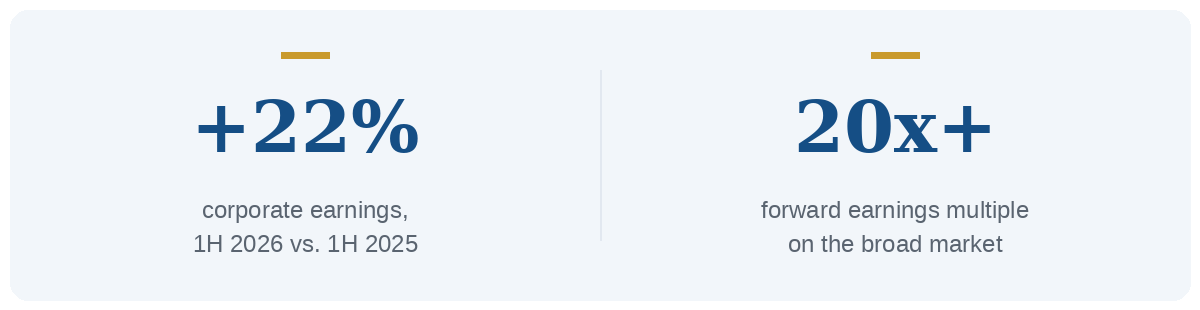
Valuations: Corporate earnings rose 22% in the first half of 2026 compared with the first half of 2025. That growth has supported equity prices, but with the market trading above 20 times forward earnings, continued earnings delivery will be needed to justify further gains. Whether hyperscalers can monetize the AI capital they have invested will play a large role.
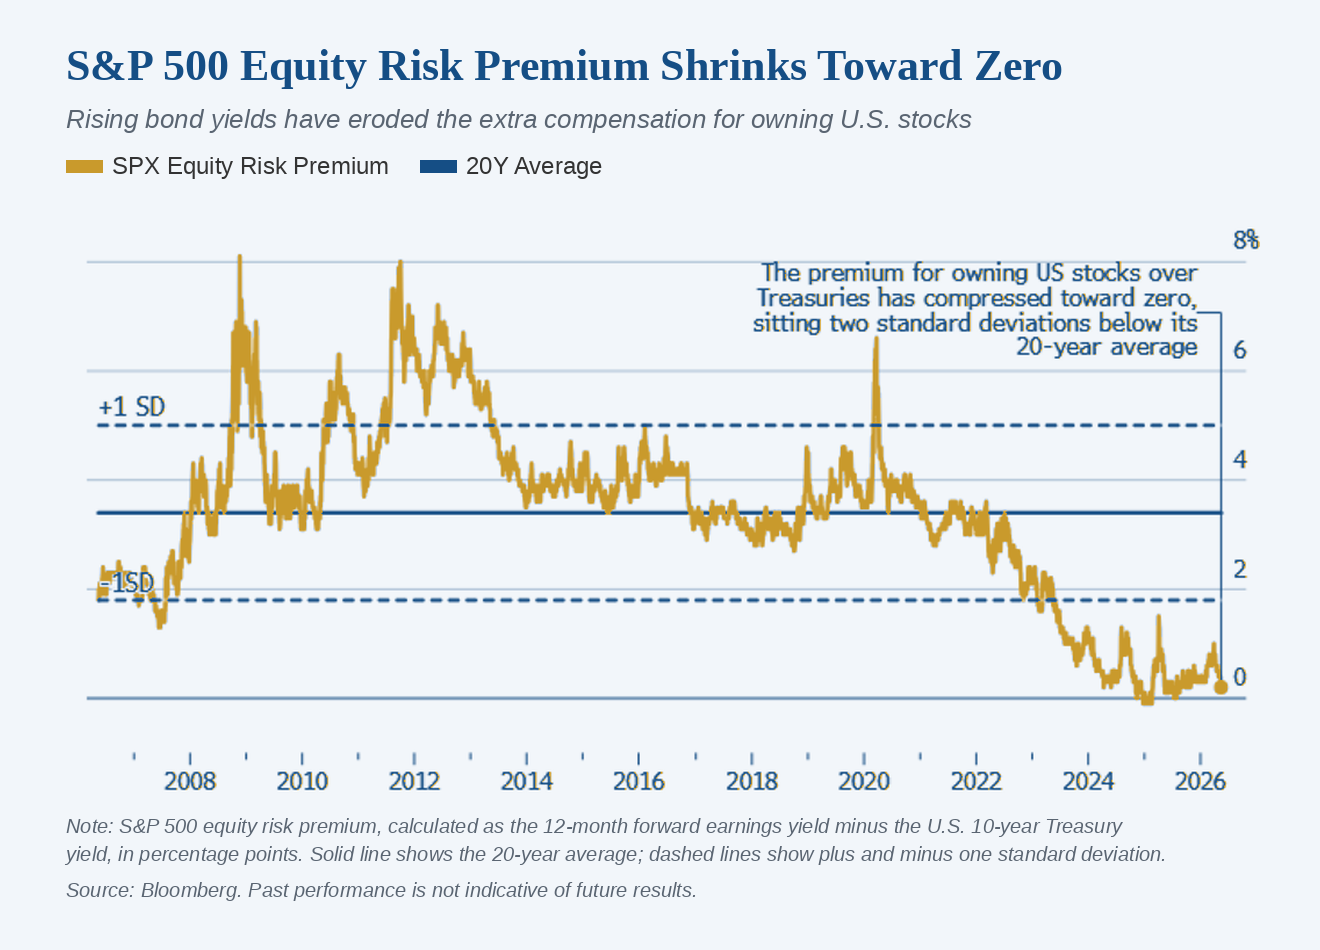
Equity risk premium compression: The equity risk premium, which compares equity valuations to interest rates, is trading at tight levels. That suggests fixed income offers compelling relative value versus equities.
Debt pressures: Heavy concurrent public spending and corporate debt refinancing are driving up the term premium in the fixed income market, putting structural upward pressure on long-duration yields.
Policy outlook: Elevated headline inflation has removed expectations for near-term rate cuts. Markets expect the Fed to hold rates steady through the summer while the FOMC monitors the pass-through of high core producer prices.
Conclusion
We continue to examine the path to AI monetization and have positioned portfolios to account for that risk. As we head into the second half of 2026, we expect the focus to shift from AI earnings and their contribution to GDP to the tangible return on the investments already made and still to come. We remain positioned to benefit from AI while managing the exposure: tilting portfolios toward value-oriented companies, allocating to active managers, investing internationally, staying underweight corporate debt, and owning real assets like gold. We believe client portfolios are prepared for a range of outcomes rather than being dependent on any single one.
Important Disclosures
This commentary is provided for informational and educational purposes only and does not constitute investment advice, a recommendation, or an offer to buy or sell any security or investment product. Any views or opinions expressed are as of the date of publication and are subject to change without notice.
Past performance is not indicative of future results. All investments involve risk, including the potential loss of principal. Diversification and asset allocation strategies do not guarantee a profit or protect against loss in declining markets.
Forward-looking statements and expectations are based on current assumptions, market conditions, and available information, which may prove to be incorrect. Actual results may differ materially.
References to specific indices, asset classes, or investment strategies are for illustrative purposes only. Index performance is unmanaged and does not reflect the deduction of fees or expenses. Investors cannot invest directly in an index.
This material may reference economic data, market estimates, or third-party sources believed to be reliable; however, accuracy and completeness cannot be guaranteed.
Please consult your Towneley wealth advisor if you have questions about your portfolio.
Index returns referenced are unmanaged, reflect the reinvestment of dividends where applicable, do not reflect fees, and cannot be invested in directly. Past performance is not indicative of future results. This commentary reflects the opinions of Towneley as of the date of publication, is subject to change, and is for informational purposes only. It is not investment, legal, or tax advice.